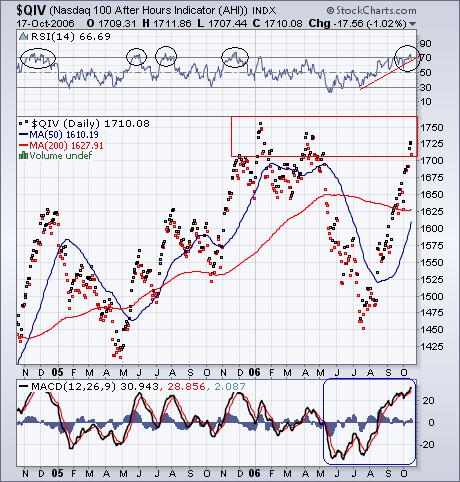
Nasdaq 100 after hours indicatoris close to 06 past tops...

Nasdaq 10 dma record highs is showing negative divergence...

(Weekly)
Nasdaq volume declining chart shows an interesting MACD
going from a 3 or more year high to a 3 or more year low...
Charts and comments are NEVER INTENDED AS ADVICE...
00K