Experts Predict Wave of Bankruptcies
"The American consumer is arguably the weakest link in the credit chain," a financial advisor says. (CFO.com)
"http://www.cfo.com/printable/article.cfm/8135376/c_8158206?f=options">
Gates warns of return to Internet bubble era (International Herald Tribune)
"http://www.iht.com/articles/2006/11/09/yourmoney/msft.php">
Skittish investors have steered clear of semiconductor stocks, fearing that the next downturn could be around the corner in the famously cyclical industry.
(The Street.com)
"http://www.thestreet.com/newsanalysis/techsemis/10321273.html">
Japan Machine Orders Unexpectedly Slump; Stocks Drop (Bloomberg)
"http://www.bloomberg.com/apps/news?pid=20601080&sid=a7kcxLYK4wuc&refer=asia">
Not responsible for content found on other sites.
00K
Friday, November 10, 2006
Thursday, November 09, 2006
HOT SPOT CHARTING
(Click charts to enlarge)


Thanks for visiting...


Thanks for visiting...
00K
EMAIL- hotspotcharting-ook@yahoo.com
EMAIL- hotspotcharting-ook@yahoo.com
Semiconductor Index
(Click chart's to enlarge)

Semiconductor's, Jan/Mar 06 top...
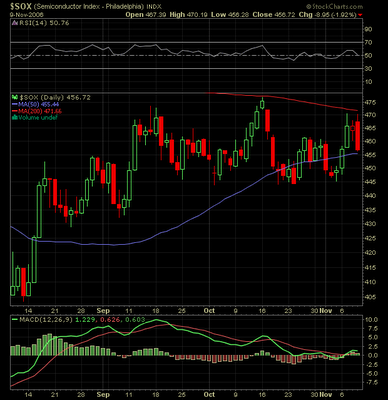
Semiconductor's, Aug/Nov 06 Topping pattern?

Here???, Here?
Or none of the above...
Charts and comments are NEVER INTENDED AS ADVICE...
EMAIL- hotspotcharting-ook@yahoo.com
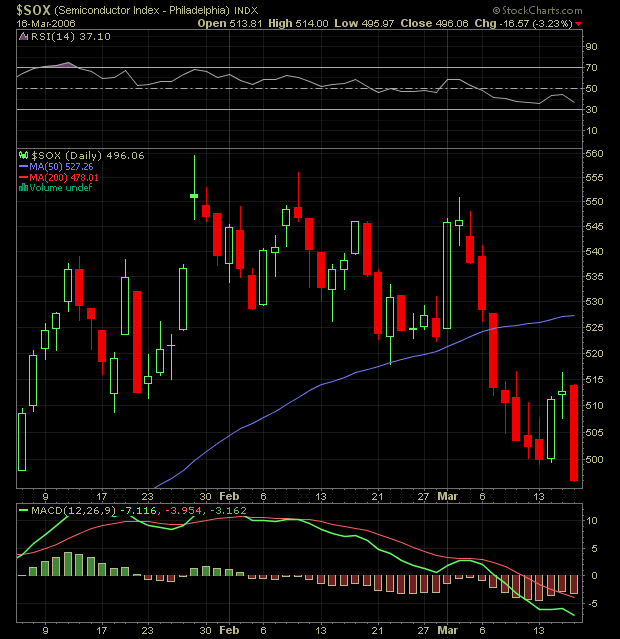
Semiconductor's, Jan/Mar 06 top...

Semiconductor's, Aug/Nov 06 Topping pattern?

Here???, Here?
Or none of the above...
Charts and comments are NEVER INTENDED AS ADVICE...
EMAIL- hotspotcharting-ook@yahoo.com
Topping?
Here's two charts showing potential bearish reversal pattern's based upon candlestick interpretation.
Do these pattern's work?
They work about 75-80% of the time.
As alway's confirmation is needed...

The last two candlesticks formed a Bearish Engulfing Pattern.
Confirmation is needed...
The last two candlesticks formed a Bearish Dark Cloud Cover Pattern.
Confirmation is needed...
00K
EMAIL- hotspotcharting-ook@yahoo.com
Do these pattern's work?
They work about 75-80% of the time.
As alway's confirmation is needed...

The last two candlesticks formed a Bearish Engulfing Pattern.
Confirmation is needed...

The last two candlesticks formed a Bearish Dark Cloud Cover Pattern.
Confirmation is needed...
00K
EMAIL- hotspotcharting-ook@yahoo.com
Nasdaq
(Click the chart to enlarge)

Cisco up 7% after hours after topping forecast. This COULD move the Nasdaq higher at the open and cause a breakout from the megaphone formation.
However with the recent distribution days a reversal later in the day MAY bring about a false breakout. Either way confirmation is needed...
Charts and comments are NEVER INTENDED AS ADVICE...
00K
EMAIL- hotspotcharting-ook@yahoo.com

Cisco up 7% after hours after topping forecast. This COULD move the Nasdaq higher at the open and cause a breakout from the megaphone formation.
However with the recent distribution days a reversal later in the day MAY bring about a false breakout. Either way confirmation is needed...
Charts and comments are NEVER INTENDED AS ADVICE...
The larger your position in a given stock, the harder it will be for you to sell when you are ready. If the buyers aren’t there the day you wish to sell, your sale will push a stock lower or even crash it and you will end up losing much of your paper profits just in the process of selling. Lots of folks think this kind of risk only applies to very large players like fund managers, but it also applies to individual speculators today as well.
"Jesse Livermore"
Thanks for visiting...
00K
EMAIL- hotspotcharting-ook@yahoo.com
Wednesday, November 08, 2006


Tuesday, November 07, 2006
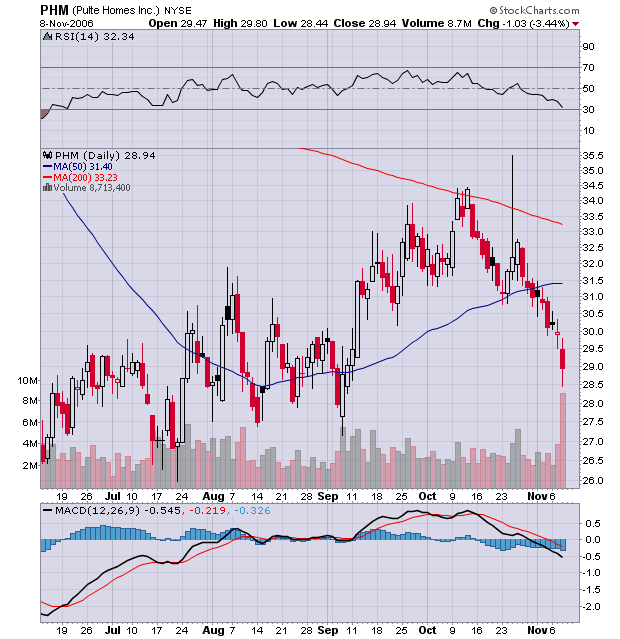
Toll Brothers, Inc

Toll Brothers sees no end to home slump (CNN News)
http://money.cnn.com/2006/11/07/news/companies/toll_brothers_outlook/index.htm?postversion=2006110708
Australian Central Bank Raises Benchmark Interest Rate to 6.25%...
Monday, November 06, 2006
Who were the sellers?<
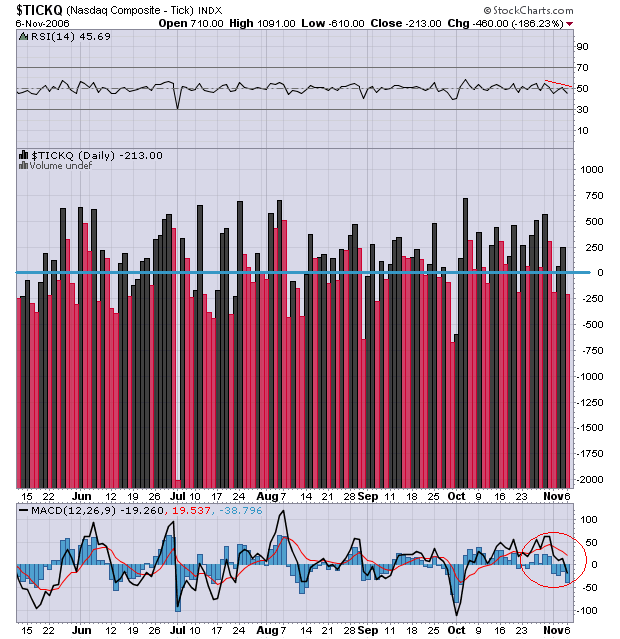
The Nasdaq Tick was negative today...

A look at a 5 day hourly chart shows that todays big morning move was being sold from 11 am until the close. The above chart confirms the negative tick...
Visit Bigcharts.marketwatch.com & Stockcharts.com for great charts and commentary...
00K
EMAIL- hotspotcharting-ook@yahoo.com
Disk Drives
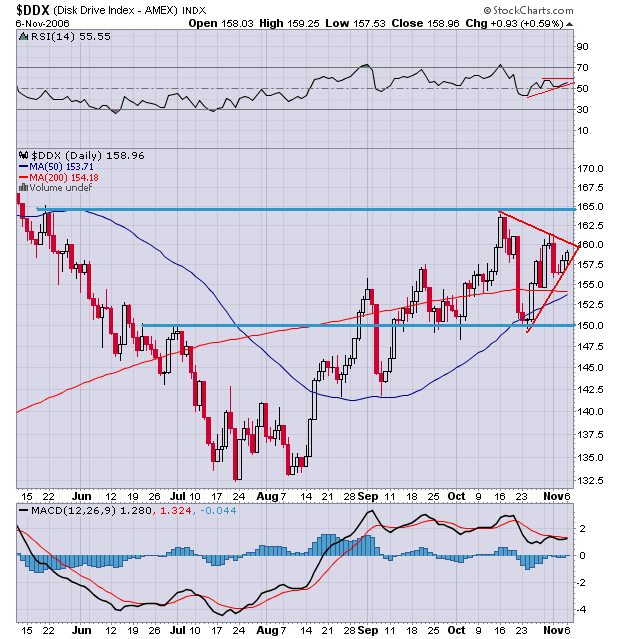
With the delayed release of Microsoft Vista,
computer sales this holiday season are perdicted to be soft...
Below are a few charts from the Disk Drive Index:
Trading under both the 50 & 200ma with gaps above and below. Barely broke out from a descending triangle on weak volume on a day that the Nasdaq rallied 35 points...
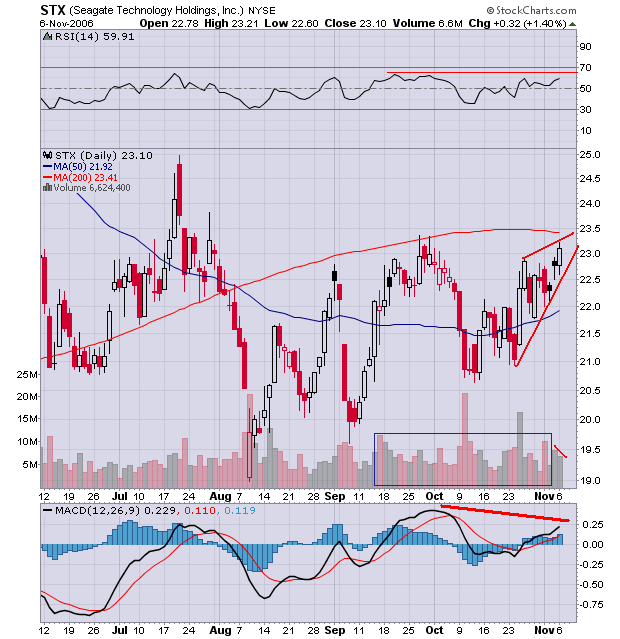
Trading under the 200ma. Moved up on lighter volume and now faces resistance and a potential ending wedge pattern...

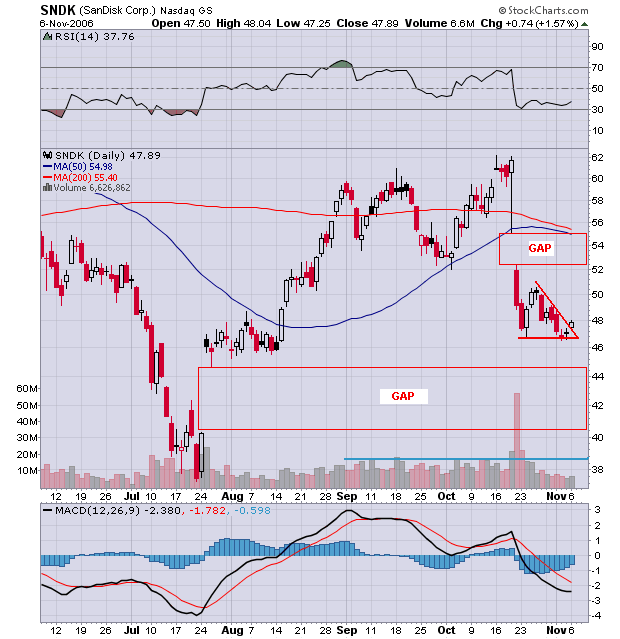
Trading under the 50ma with gaps above and below. Descending triangle pattern and volume increased today...
(Note the simularity of the pattern with SanDisk)

Trading below the 200ma and fell below rising channel on a day that the Nasdaq rallied 35 points...

Trading below the 200ma in a horizonal channel. Declining rsi, macd and several distribution days. Declined today and is resting on the 50ma...

Closed above the 50ma today but pulled well off its intraday high...
Charts and comments are NEVER MEANT AS ADVICE...
Winning trades tend to be ahead right from the start.
"Jack Schwager" Author of Market Wizards...
00K
The blog was moved to a new beta program last night and i apologize for the misalignment of any text below...
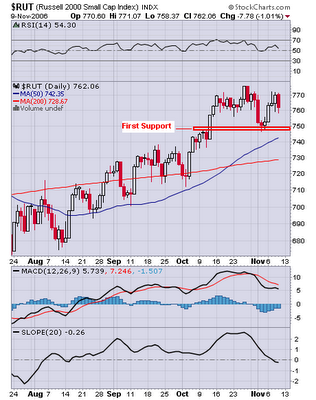
EMAIL- hotspotcharting-ook@yahoo.comRussell 2000
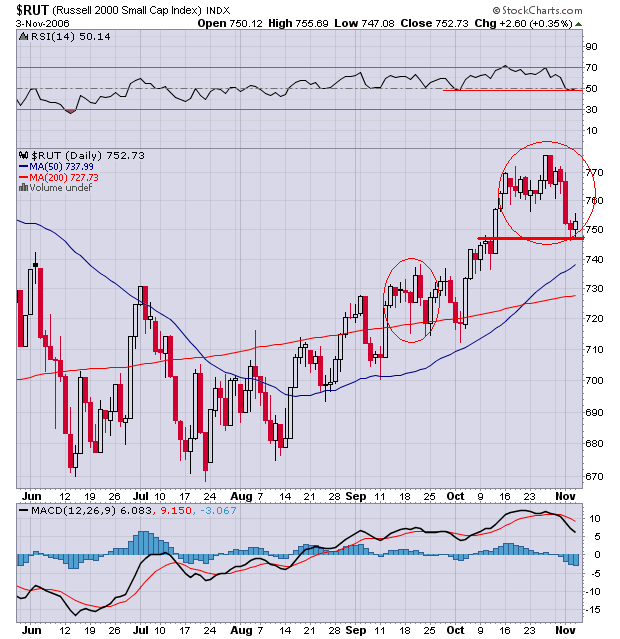
Perhaps looking bullish for monday...
The reason there are two senators for each state is so that one can be the designated driver.
"Jay Leno"
00K
Sunday, November 05, 2006
THE BEAR CASE
The October PMI Index outlines manufacturing is still growth oriented coming in at 51.2 (above 50 is considered expansion). However month to month comparisons indicates that manufracturing is slowing with a -1.7% decline from September.
Production came in at 51.9 which is a -4.2% decline from the previous month.
Supplier deliveries came in at 50.2 a -3.9% decline from the previous month.
Inventories rose to a reading of 49.4 a +3.0% rise from the previous month.
The October PMI indicates that both the overall economy and the manufacturing sector are growing at a slower rate.
New Orders
ISM's New Orders Index registered 52.1 percent in October. The index is 2.1 percentage points lower than the 54.2 percent reported in September.
Dow theory maintains that both the djia and the transports should be moving in the same direction. When the performance of the averages diverge, it is a warning that change is in the air.

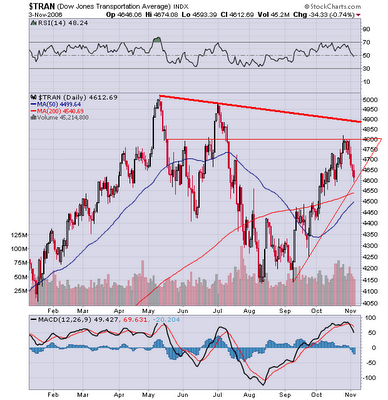
Non confirmation by the transports...
Production came in at 51.9 which is a -4.2% decline from the previous month.
Supplier deliveries came in at 50.2 a -3.9% decline from the previous month.
Inventories rose to a reading of 49.4 a +3.0% rise from the previous month.
The October PMI indicates that both the overall economy and the manufacturing sector are growing at a slower rate.
New Orders
ISM's New Orders Index registered 52.1 percent in October. The index is 2.1 percentage points lower than the 54.2 percent reported in September.
Dow theory maintains that both the djia and the transports should be moving in the same direction. When the performance of the averages diverge, it is a warning that change is in the air.
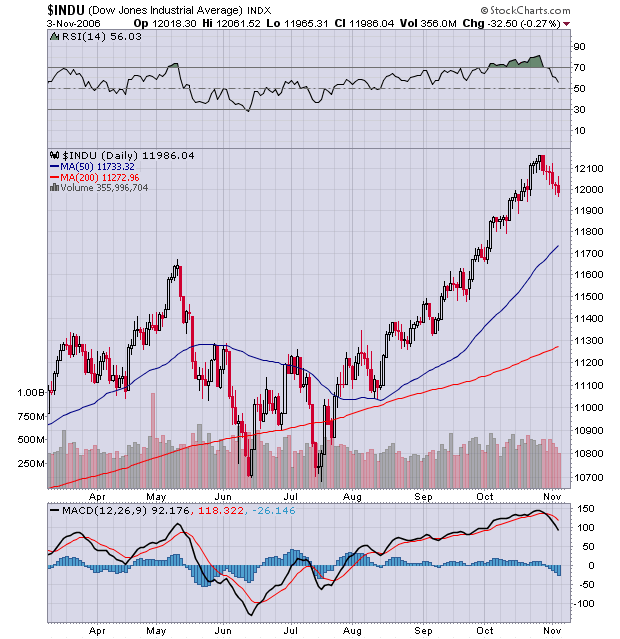

Non confirmation by the transports...
CPI, the consumer price index rose 2.9% from September 2005. This is inflationary and is bearish...
PPI, the producer price index for finished goods fell 1.3 percent in September which is deflationary for domestic producers and is bearish...
As documented in recent charts (see below) there is weakness in the restaurant, computer software, retail, semiconductor's etc..........
Charts and comments are NEVER INTENTED AS ADVICE...
Thanks for visiting...
00K
EMAIL- hotspotcharting-ook@yahoo.com
Subscribe to:
Comments (Atom)