With the delayed release of Microsoft Vista,
computer sales this holiday season are perdicted to be soft...
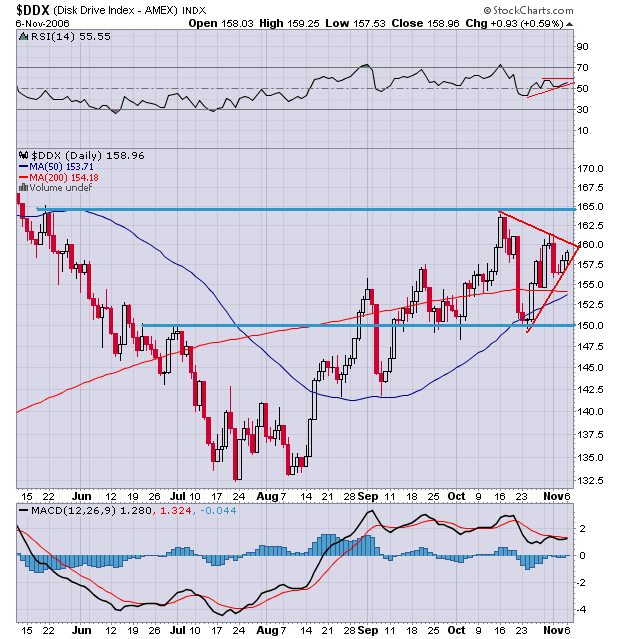
Below are a few charts from the Disk Drive Index:
Trading under both the 50 & 200ma with gaps above and below. Barely broke out from a descending triangle on weak volume on a day that the Nasdaq rallied 35 points...
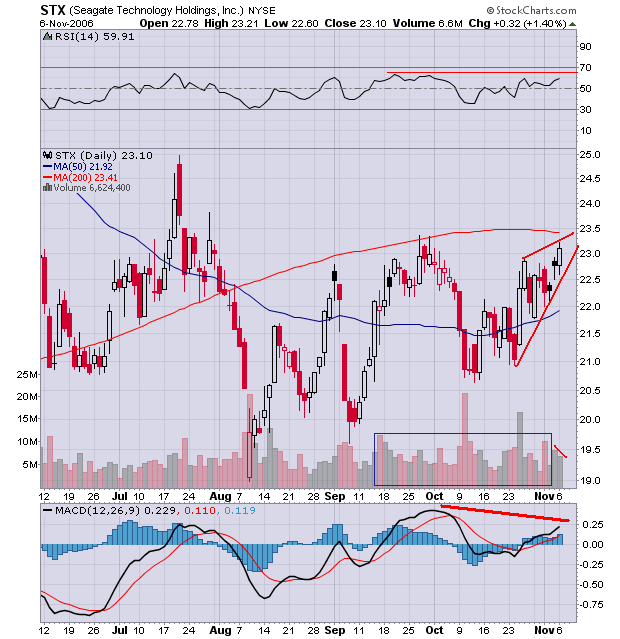
Trading under the 200ma. Moved up on lighter volume and now faces resistance and a potential ending wedge pattern...

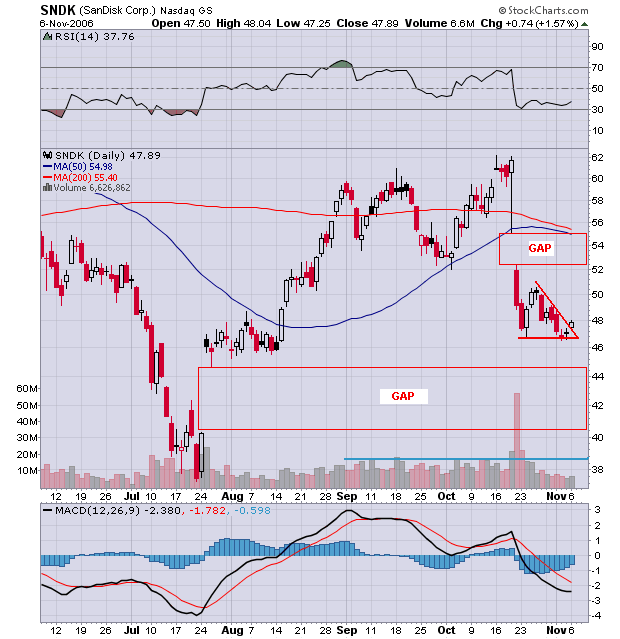
Trading under the 50ma with gaps above and below. Descending triangle pattern and volume increased today...
(Note the simularity of the pattern with SanDisk)

Trading below the 200ma and fell below rising channel on a day that the Nasdaq rallied 35 points...

Trading below the 200ma in a horizonal channel. Declining rsi, macd and several distribution days. Declined today and is resting on the 50ma...

Closed above the 50ma today but pulled well off its intraday high...
Charts and comments are NEVER MEANT AS ADVICE...
Winning trades tend to be ahead right from the start.
"Jack Schwager" Author of Market Wizards...
00K
The blog was moved to a new beta program last night and i apologize for the misalignment of any text below...
EMAIL- hotspotcharting-ook@yahoo.com