
Nasdaq, now up against the long term trendline.
Currently making it's fourth attempt at this long term resistance and with the stoch's overbought any breach could be considered suspect...
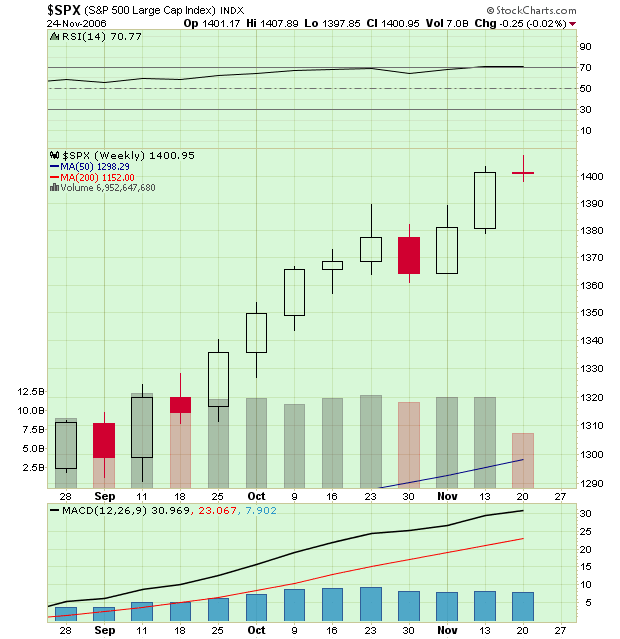
SP500, weekly chart with Doji.
Bearish candlestick pattern.
Potential change of direction. Confirmation needed...
Thanks for visiting...
00K
The email address is offered only as a courtesy to those readers who want to express their comments...
EMAIL- hotspotcharting-ook@yahoo.com