Up,down or sideways? Review the charts for any clues that may help you with your own research. Thinking for yourself can be a pleasure and developing and applying strategic stock market research skills could give you the edge...

Google

Tuesday, October 31, 2006

Trick or Treat at the BATES MOTEL


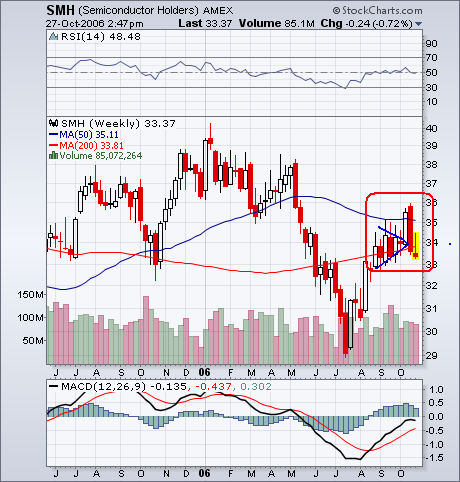
Dow Jones US Hotel Index:


The weekly chart is showing that this index is
at overhead resistance...

(The hotel stock charts below use a daily format)


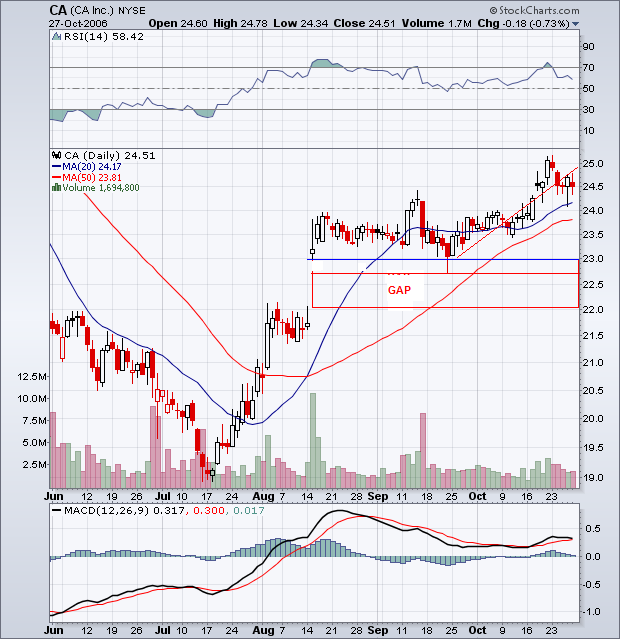
Testing overhead resistance while showing
some negative divergence on the oscillator's...


Testing overhead resistance on declining volume...


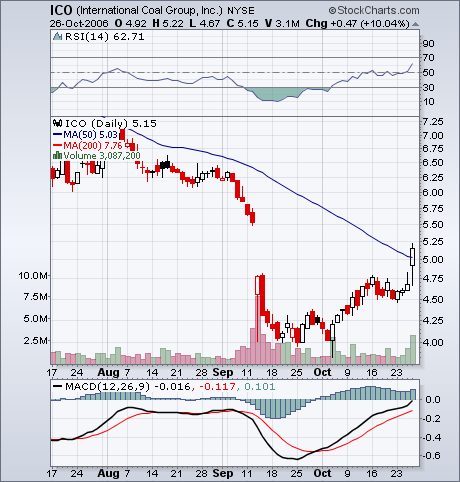
Will FCH overcome its 50 & 200ma and keep the
uptrend channel intact?


Potential bear flag.
Note the recent distribution days...


Pennant. Watch which way it breaks...


Broke downwards from a raising wedge...


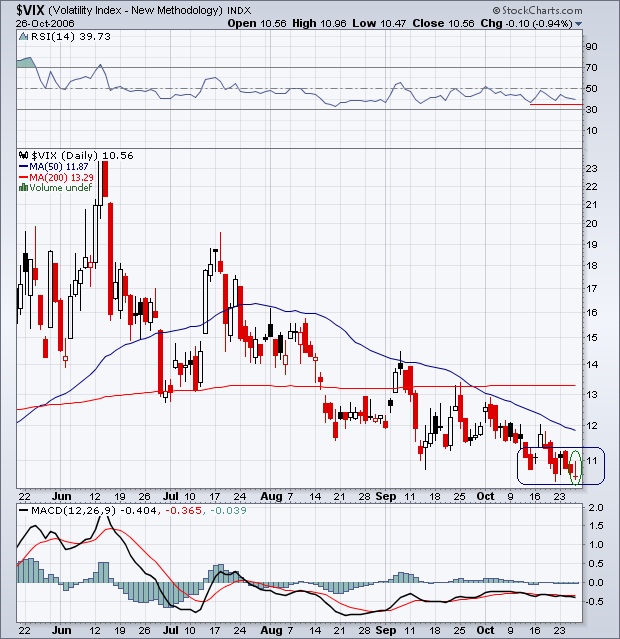
Mean reversion comes to mind...


Charts and comments are NEVER INTENDED AS ADVICE...

Have a great Halloween!

00K

EMAIL- hotspotcharting-ook@yahoo.com

In the news (Links)

WASHINGTON (MarketWatch) -- U.S. consumer confidence dipped unexpectedly in October on growing pessimism about the job market and the economy, the Conference Board said Tuesday.
http://www.marketwatch.com/news/story/Story.aspx?guid=ad67bb8b-ce2d-42af-86d6-0386d248d1a0&siteid=mktw&dist=morenews

WASHINGTON (MarketWatch) -- The Chicago region's economy weakened sharply in October with a worrisome rise in inventories, according to the Chicago purchasing managers' index released Tuesday.
http://www.marketwatch.com/news/story/Story.aspx?guid=a0d95bd2-2a99-48db-bec7-8eb5e32a8d42&siteid=mktw&dist=morenews

WASHINGTON (MarketWatch) -- Consumer sentiment strengthened slightly in late October, according to media reports Friday of proprietary research from the University of Michigan.
http://www.marketwatch.com/news/story/Story.aspx?guid=aa484c08-c8e6-4ef7-b42d-7387548fd862&siteid=mktw&dist=morenews

UBS Reports 21% Decline in Profit on Trading Slump
Oct. 31 (Bloomberg) -- UBS AG, Europe's biggest bank by assets, said third-quarter profit fell 21 percent, missing analysts' estimates after trading revenue dropped at its securities unit.
http://www.bloomberg.com/apps/news?pid=20601087&sid=aWEFcP22LU2g&refer=home


There are nights when the wolves are silent and only the moon howls.
~George Carlin


00K

EMAIL- hotspotcharting-ook@yahoo.com

Monday, October 30, 2006

Booo....

Let's try halloween orange.

(Click any chart to enlarge)

A look at a few hourly charts before tuesday's open...


QQQQ, rebounded a bit from fridays decline.
Closed below support...


IWM, closed at the 21ma but took heavy selling
an hour before the close...


SPY, stayed below its 21ma all day.
Watch which way it breaks...


DIA, closed at support. Note the RSI turned
back at the 50 line...


Just like a ghost, you've been a-hauntin' my dreams,
So I'll propose on Halloween.
Love is kinda crazy with a spooky little girl like you.
~Classics IV


Thanks for visiting...

00K

EMAIL- hotspotcharting-ook@yahoo.com

Percent of stocks above 50dma......


NASDAQ...


S&P 100...


S&P 500...

Charts and comments are NEVER INTENDED AS ADVICE...


00K


EMAIL- hotspotcharting-ook@yahoo.com

Upcoming Expo's

Futures & Options Expo 2006
http://www.futuresindustry.org/expo2006-2658.asp

The Traders Expo Las Vegas
http://www.tradersexpo.com/tradersexpo/lasvegas/main.asp

(Not responsible for content found on other sites)

00K

Volatility Indexes


The Volatility Index, which shows the market's expectation of 30-day volatility. It is constructed using the implied volatilities of a wide range of S&P 500 index options. This volatility is meant to be forward looking and is calculated from both calls and puts. The VIX is a widely used measure of market risk...

00K


EMAIL- hotspotcharting-ook@yahoo.com

Sunday, October 29, 2006

Click any chart to enlarge...

Japan's Industrial Production Slipped 0.7% From Record in Sept.
http://www.bloomberg.com/apps/news?pid=20601087&sid=aeyQ6hABlgVI&refer=home

Shares of Rinker Group were up sharply Friday following Cemex’s bid to buy the Australian company for $12.8 billion.
http://www.forbes.com/business/2006/10/27/cemex-rinker-update-markets-equity-cx_mk_1027markets12.html


RIN & CX charts are provided to accompany the story above...
(Not responsible for content found on other sites)


Brief review of RSI & MACD indicators...

The Relative Strenghth Index-RSI, is a technical momentum indicator that compares the magnitude of recent gains to recent loses.
Buy and sell signals can be generated by looking for positive and negative divergences between the RSI and the underlying stock.
The RSI is best used when combined with other stock-picking tools...

Moving Average Convergence Divergence - MACD, is a trend following momentum indicator that shows the relationship between two moving averages of prices.
1. Crossovers - As shown in the chart above, when the MACD falls below the signal line, it is a bearish signal, which indicates that it may be time to sell. Conversely, when the MACD rises above the signal line, the indicator gives a bullish signal, which suggests that the price of the asset is likely to experience upward momentum. Many traders wait for a confirmed cross above the signal line before entering into a position to avoid getting getting "faked out" or entering into a position too early.
2. Divergence - When the security price diverges from the MACD. It signals the end of the current trend.
3. Dramatic rise - When the MACD rises dramatically - that is, the shorter moving average pulls away from the longer-term moving average - it is a signal that the security is overbought and will soon return to normal levels. Also watch for a move above or below the zero line because this signals the position of the short-term average relative to the long-term average. When the MACD is above zero, the short-term average is above the long-term average, which signals upward momentum. The opposite is true when the MACD is below zero...

To know is to do!
"Socrates"

Thanks for visiting...

00K


EMAIL- hotspotcharting-ook@yahoo.com

Let's look at a few restaurants...

  • Monday's HOT SPOT CHARTING short candidate

    OSI May Restate Results Over Gift Cards
    Potential liability for the restaurant chain is estimated at between $20 million and $40 million.

    http://www.cfo.com/article.cfm/8097376/c_8098516?f=home_todayinfinance


    CAKE, closed at support...


    CPKI, closed at support. RSI moved below trendline.
    Note the recent massive distribution day...


    LNY, upwards channel but turned away at resistance.
    Watch which way it breaks...


    The big money is made by the sitting, not the thinking.
    Once a position is taken, the hardest thing to do is to be patient and wait for the move to play out.
    "Jesse Livermore"


    EMAIL- hotspotcharting-ook@yahoo.com

Saturday, October 28, 2006

LINKS

U.K. Inflation Will Reach Fastest Pace Since 1997, NIESR Says
http://www.bloomberg.com/apps/news?pid=20601102&sid=aL2Pp_Pe.mUQ&refer=uk

Australian Drought May Cut GDP Growth, Force Up Rates
http://www.bloomberg.com/apps/news?pid=20601081&sid=aGKZs0meCyYk&refer=australia

November 9-10, 2006
Capital Flows -- IMF Seventh Jacques Polak Annual Research Conference , Washington, D.C.

November 10, 2006
IMF Center Economic Forum: How Does Capital Account Liberalization Affect Economic Growth?, Washington, D.C.

Not responsible for information found on other sites...

00K


Friday, October 27, 2006

Computer Software


Computer Software Index closed below it's 20dma...
There are 31 components held in this index.
Below are the top 7...


RSI negative and MACD crossover...


Closed below support and sitting between it's 20 & 50dma...


Uptrend intact but RSI below support.
MACD showing some negative divergence...


Above 20dma but closed below horizonal support.
RSI & MACD showing negative divergence...


Slightly pulled back from uptrend resistance...


Resistance at the 20 & 50dma...


Potential triple top...

Charts and comments are NEVER INTENDED AS ADVICE...

Thanks for visiting...

00K

Semiconductor's


False breakout on the SMH weekly chart...


H&S formation on the weekly $SOX chart...


Manufacturer and supplier of discrete semiconductor products, primarily to the communications, computing, industrial, consumer electronics, and automotive markets...


Infineon Technologies AG engages in the design, development, manufacture, and marketing of semiconductors...


Cree, Inc. engages in the development and manufacture of semiconductor materials and devices


Fairchild Semiconductor International, Inc., through its subsidiary, engages in the design, development, manufacture, marketing, and sale of power analog, power discrete, and nonpower semiconductor solutions...

Thanks for visiting...

00K


Thursday, October 26, 2006

Click any chart to enlarge...


Focuses on acquisition, exploration and development of gold and copper mineral resources in Asia including properties in Indonesia, Kazakstan, Myanmar, and Fiji.


Peabody Energy is the world's largest private-sector coal company...


At resistance...


Cameco Corporation engages in the exploration, development, mining, refining, and conversion of uranium that is used as fuel for generating electricity in nuclear power reactors worldwide.
Potential double bottom with positive divergence...


EUROZINC IS A CANADIAN BASED METALS COMPANY, ENGAGED IN THE ACQUISITION, EXPLORATION, DEVELOPMENT AND MINING OF BASE METAL DEPOSITS INTERNATIONALLY .
I recently read zinc was in demand...


Metallurgical coal is primarily used to produce coke, a key raw material used in the steel making process. Generally, metallurgical coal sells at a premium to steam coal because of its higher quality and its importance and value in the steel making process...

Share your market thoughts by leaving a message...

00K

Bookmark this site for easy access...


Did the $VIX make a bottom today?
Note the rsi positive divergence...


Dow Jones composite Average:
Bearish Deliberation Candlestick Pattern could signal a change in direction.
Confirmation is needed.
Note the declining volume...

Charts and comments are NEVER INTENTED AS ADVICE...

00K

HOT SPOT CHARTING


DJ Transportation Average Index is up against resistance.
Also note the negative divergence on the rsi...


Nasdaq Advance-Decline Issues is showing a simular
pattern prior to the leg down in July...


(Click any chart to enlarge)

Thanks for visiting....

00K

New Home Price Falls the Most Since 1970


Dollar Declines as New Home Price Falls the Most Since 1970
http://www.bloomberg.com/apps/news?pid=20601083&sid=aW0QxRi1raDU&refer=currency

$CRB and PAPER


Breakout from a pennant formation...


DJ Paper Index broke below the base of a double top.
If it dosent reverse today the target is the July lows
for this formation...

Could the weakness in paper be confirming a slowing economy?

00K