(Click charts to enlarge)
Dow Jones World Stock Index could be making a lower high...
SSEC, Double top potential...
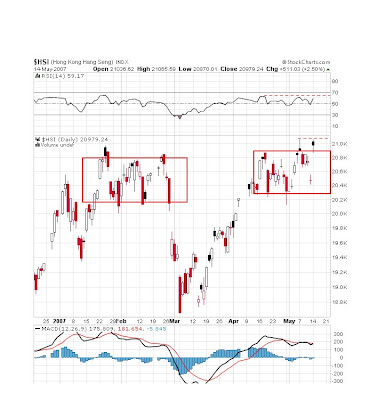
HSI, Could be completing a blow off top...
Charts and comments are NEVER INTENDED AS ADVICE...
Thanks for visiting...
00K
The email address is provided only as a courtesy to those readers who want to express their comments...
EMAIL- hotspotcharting-ook@yahoo.com
Hot Spot Charting
Up,down or sideways? Review the charts for any clues that may help you with your own research. Thinking for yourself can be a pleasure and developing and applying strategic stock market research skills could give you the edge...
Wednesday, June 20, 2007
Saturday, June 16, 2007
HOT SPOT CHARTING...
(Click charts to enlarge)
Nasdaq, Long term daily chart..........
QQQQ, Gaped higher on unimpressive volume.
Will it make a quick jump towards the trend line resistance in the 48.50 area before reversing?..........
Disclaimer: The content in this blog is for leisure purposes only. The content is not intended as an offer or solicitation to buy or sell any securities. Do not use the content to make any investment decisions.
Thanks for visiting...
00K
The email address is provided only as a courtesy to those readers who want to express their comments...
EMAIL- hotspotcharting-ook@yahoo.com
Friday, June 15, 2007
HOT SPOT CHARTING...
SEC Ends Uptick Rule
The Securities and Exchange Commission (SEC) has eliminated the so-called “uptick rule,” which prevents short-sellers from selling stock in a down market. SEC commissioners voted 5-0 to eliminate the rule, which was established in 1938 as a way to prevent disorderly selling during market downturns. Under the rule, a short sale could only be executed on an “uptick,” i.e., when a share was trading up. The idea was to prevent stocks in free fall from being forced ever lower by short-sellers.
http://www.indexuniverse.com/index.php?option=com_content&view=article&id=2848&Itemid=28
HONG KONG (MarketWatch) -- China's government is expected to announce imminent changes to monetary policy -- possibly including a rate hike and a lifting in the ratio of funds banks must hold in reserve against deposits -- as officials step up efforts to cool the nation's accelerating economy, said analysts.
http://www.marketwatch.com/news/story/china-rate-hike-reserve-tightening/story.aspx?guid=%7BF382A43E%2D6D94%2D42A3%2D9D4D%2DB11AD055A048%7D&siteid=yhoof
Thanks for visiting...
00K
The email address is provided only as a courtesy to those readers who want to express their comments...
EMAIL- hotspotcharting-ook@yahoo.com
Thursday, June 14, 2007
HOT SPOT CHARTING...
Tuesday, June 12, 2007
HOT SPOT CHARTING...
Wednesday, May 23, 2007
HOT SPOT CHARTING...
S & P Financial Sector Bullish percent Index...
Philly Semiconductor Index,
Potential false breakout...
Charts and comments are NEVER INTENDED AS ADVICE...
Thanks for visiting...
00K
The email address is provided only as a courtesy to those readers who want to express their comments...
EMAIL- hotspotcharting-ook@yahoo.com
Sunday, May 20, 2007
HOT SPOT CHARTING...
(Click charts to enlarge)
DJIA, Update...
Chart: The Nasdaq 100 with the Philly Semiconductor Index (SOX). The chip sector could be arguably the most significant single sector affecting the Nasdaq. While the two indexes are highly correlated and generally move in tandem, be on the lookout for divergences, such as when the SOX fails to confirm a move by the Nasdaq. These divergences are often an early clue that the move may not be sustainable...
Charts and comments are NEVER INTENDED AS ADVICE...
Thanks for visiting...
00K
The email address is provided only as a courtesy to those readers who want to express their comments...
EMAIL- hotspotcharting-ook@yahoo.com
Thursday, May 17, 2007
HOT SPOT CHARTING...
Wednesday, May 16, 2007
HOT SPOT CHARTING...
Tuesday, May 15, 2007
HOT SPOT CHARTING...
(Click charts to enlarge)
HANG SENG INDEX,
Could the HSI fill the gap at the 50ma........
NIKKEI, Looking a bit vulnerable.
Eye on the neckline...
Charts and comments are NEVER INTENDED AS ADVICE...
Thanks for visiting...
00K
The email address is provided only as a courtesy to those readers who want to express their comments...
EMAIL- hotspotcharting-ook@yahoo.com
Monday, May 14, 2007
HOT SPOT CHARTING...
(Click charts to enlarge)
HSI, Well you have to hand it to the Chinese.
They do come out swinging. Gaped up over 500 points in the first half hour of trading.
But then went nowhere...
China's April Inflation Adds Fuel to Stock Bubble (Bloomberg.com)
http://www.bloomberg.com/apps/news?pid=20601089&sid=agbrDukDFrdo&refer=china
NASDAQ, Two distribution days in the last three trading days.
Could we see the gap get filled soon...
Thanks for visiting...
00K
The email address is provided only as a courtesy to those readers who want to express their comments...
EMAIL- hotspotcharting-ook@yahoo.com
Sunday, May 13, 2007
HOT SPOT CHARTING...
(Click charts to enlarge)
Whilshire 5000, A broad market indicator.
Has room to move higher in the upwards channel.
However a break below the channel from a rising wedge could happen just as well...
Nasdaq 100 Index, Moved back towards the top of the channel on declining volume...
S&P500, Percent of stocks above 150 day moving average.
Although we could see the S&P 500 index move higher it appears to be in a topping process with a declining percentage of stocks above their 150 day moving average...
Disclaimer: The content in this blog is for leisure purposes only. The content is not intended as an offer or solicitation to buy or sell any securities. Do not use the content to make any investment decisions.
Thanks for visiting...
00K
The email address is provided only as a courtesy to those readers who want to express their comments...
EMAIL- hotspotcharting-ook@yahoo.com
HOT SPOT CHARTING...
(Click charts to enlarge)
Hang Seng, Gap down Doji. Potential change of direction on Monday.
MACD trending lower but now has room to turn up...
FXI, Large volume spike. Could be forecasting a move in the Hang Seng...
EWH, Large volume spike...
QQQQ, Flag...
IWM...
Charts and comments are NEVER INTENDED AS ADVICE...
Thanks for visiting...
00K
The email address is provided only as a courtesy to those readers who want to express their comments...
EMAIL- hotspotcharting-ook@yahoo.com
Thursday, May 10, 2007
HOT SPOT CHARTING...
April was largely a sales disaster for most of the nation's biggest retail-chain operators, as consumers pulled in their purse strings after March's spending spree and as they faced rising prices at the gas pump, as well as a slumping housing market. (MarketWatch.com)
http://www.marketwatch.com/news/story/aprils-slide-retail-sales-actually/story.aspx?guid=%7B972C8768%2DEFEE%2D46D3%2DA584%2DA721B9501D86%7D
Trade gap widens sharply in March
Bigger drag on first quarter growth than first thought(MarketWatch.com)
http://www.marketwatch.com/news/story/us-march-trade-gap-highest/story.aspx?guid=%7B7BBED803%2D2067%2D4B25%2DB7A0%2DC3261ED27E43%7D
Crude Oil Rises on Signs U.S. Gasoline Supply Is Insufficient (Bloomberg.com)
http://www.bloomberg.com/apps/news?pid=20601072&sid=a2haBEsZGy_w&refer=energy
Bank of England Lifts Benchmark Rate to Six-Year High (Bloomberg.com)
http://www.bloomberg.com/apps/news?pid=20601087&sid=a.fbbdNEfwBI&refer=worldwide
Thanks for visiting...
00K
The email address is provided only as a courtesy to those readers who want to express their comments...
EMAIL- hotspotcharting-ook@yahoo.com
Wednesday, May 09, 2007
HOT SPOT CHARTING...
(Click charts to enlarge)
QQQQ, Two day hourly chart...
Nasdaq Transportation Index,
A potential double top with a right side diamond pattern could be a warning...
QID, MACD showing positive divergence...
Charts and comments are NEVER INTENDED AS ADVICE...
Thanks for visiting...
00K
The email address is provided only as a courtesy to those readers who want to express their comments...
EMAIL- hotspotcharting-ook@yahoo.com
Tuesday, May 08, 2007
HOT SPOT CHARTING...
Ben to move the market but which way.........
WILSHIRE 5000 showing a distribution day...
Cisco's profit jumps 34% on sales increase(MarketWatch.com)
http://www.marketwatch.com/news/story/ciscos-profit-climbs-34/story.aspx?guid=%7BFA7ED486%2D6DC0%2D4168%2DB7A6%2D07225D24AB10%7D
Tyco profit declines on restructuring charges(MarketWatch.com)
http://www.marketwatch.com/news/story/tyco-earnings-tumble-restructuring-charges/story.aspx?guid=%7B386F95E1%2DB6FB%2D4552%2D9DD6%2DA65F4CADB3F1%7D&tool=1&dist=bigcharts&
U.S. Home Prices to Drop in 2007 on Loan Standards, First Since 1930's (Bloomberg.com)
http://www.bloomberg.com/apps/news?pid=20601087&sid=aoMSaUJr0qD4&refer=worldwide
Chinese buyers give Buick a second wind
Last year, brand sold more there than in U.S. (Detroit FP)
http://www.freep.com/apps/pbcs.dll/article?AID=/20070508/BUSINESS01/705080314/1002/BUSINESS
Ford to close Ohio plant, ousting 1,100 employees (Arizona Republic)
http://www.azcentral.com/business/articles/0508biz-ford0508.html
Charts and comments are NEVER INTENDED AS ADVICE...
Thanks for visiting...
00K
The email address is provided only as a courtesy to those readers who want to express their comments...
EMAIL- hotspotcharting-ook@yahoo.com
HOT SPOT CHARTING...
April Foreclosure Filings More Than Double Over 2006 (Bloomberg.com)
http://www.bloomberg.com/apps/news?pid=20601087&sid=alXig2Cqe.rA&refer=home
Huge deals fuel record-breaking M&A (FT.com)
http://www.ft.com/cms/s/810806f2-fce4-11db-9971-000b5df10621.html
More investors take risk of buying stocks with loans (USAToday)
http://www.usatoday.com/money/markets/2007-05-07-margin-usat_N.htm
Hang Seng Index (08/05/2007)
HSI 20706.35 -190.29
Thanks for visiting...
00K
The email address is provided only as a courtesy to those readers who want to express their comments...
EMAIL- hotspotcharting-ook@yahoo.com
Monday, May 07, 2007
HOT SPOT CHARTING...
Getting fitted with a crash helmet....
Disclaimer: The content in this blog is for leisure purposes only. The content is not intended as an offer or solicitation to buy or sell any securities. Do not use the content to make any investment decisions.
Thanks for visiting...
00K
The email address is provided only as a courtesy to those readers who want to express their comments...
EMAIL- hotspotcharting-ook@yahoo.com
Friday, May 04, 2007
HOT SPOT CHARTING...
(Click charts to enlarge)
QQQQ, Of course there will be seesaw choppy time frames.
Looks like it could be the opposite pattern......
Charts and comments are NEVER INTENDED AS ADVICE.
For amusement purposes only.........
Thanks for visiting...
00K
The email address is provided only as a courtesy to those readers who want to express their comments...
EMAIL- hotspotcharting-ook@yahoo.com
Thursday, May 03, 2007
HOT SPOT CHARTING...
(Click charts to enlarge)
CAC...
Could be cresting.......
DAX...
Could also be cresting............
FTSE...
Spain General Index...
Could be caught in a 3rd wave down..........
ITALY MITBEL INDEX (Milan)...
Potential H&S........
Charts and comments ARE NEVER INTENDED AS ADVICE
Thanks for visiting...
00K
The email address is provided only as a courtesy to those readers who want to express their comments...
EMAIL- hotspotcharting-ook@yahoo.com
HOT SPOT CHARTING...
Top 10 DJIA Market Crashes..........
10th Worst Stock Market Crash:
Date Started: 1/15/2000Date Ended: 10/9/2002Total Days: 999Starting DJIA: 11,792.98Ending DJIA: 7,286.27Total Loss: -37.8%
This crash required the longest recovery time of all crashes in this list. The combination of the tech bubble bursting and the September 11th terrorist attack served a deadly blow to the stock market, but relative to markets past, this was a minor one.
9th Worst Stock Market Crash:
Date Started: 11/21/1916Date Ended: 12/19/1917Total Days: 393Starting DJIA: 110.15Ending DJIA: 65.95Total Loss: -40.1%
As you will see, this market suffered about a 40% loss. It's difficult to break even after a 40% loss. On a $1,000 investment, your portfolio went down to $600. To get back to $1,000, it would have to go up 66.7%!
8th Worst Stock Market Crash:
Date Started: 9/12/1939
Date Ended: 4/28/1942
Total Days: 959
Starting DJIA: 155.92
Ending DJIA: 92.92
Total Loss: -40.4%
Although this stock market crash only took the 8th spot, it was one of the most grueling. It took nearly 3 years to recover from this crash! With WWII and the attack on Pearl Harbor, the markets had a very tough time.
7th Worst Stock Market Crash:
Date Started: 1/11/1973
Date Ended: 12/06/1974
Total Days: 694
Starting DJIA: 1051.70
Ending DJIA: 577.60
Total Loss: -45.1%
Another long market crash -one that many people still remember (think Vietnam and the Watergate scandal). This crash lasted for 694 days before bottoming out.
6th Worst Stock Market Crash:
Date Started: 6/17/1901
Date Ended: 11/9/1903
Total Days: 875
Starting DJIA: 57.33
Ending DJIA: 30.88
Total Loss: -46.1%
This is the oldest crash to make the list (DJIA records are not available before 1900). Btw, The American flag had 45 stars....
The 5th worst stock market crash:
Date Started: 11/3/1919
Date Ended: 8/24/1921
Total Days: 660
Starting DJIA: 119.62
Ending DJIA: 63.9
Total Loss: -46.6%
After this crash bottomed out in August of 1921, the decade saw tremendous growth in the stock market and the economy (often called the roaring twenties).
4th Worst Stock Market Crash:
Date Started: 9/3/1929
Date Ended: 11/13/1929
Total Days: 71
Starting DJIA: 381.17
Ending DJIA: 198.69
Total Loss: -47.9%
Although this is the shortest market crash observed, it was a deadly one. Investors saw almost half their money disappear in just two months. Often this crash is the worst in most people's minds.
3rd Worst Stock Market Crash:
Date Started: 1/19/1906
Date Ended: 11/15/1907
Total Days: 665
Starting DJIA: 75.45
Ending DJIA: 38.83
Total Loss: -48.5%
This crash was called the "Panic of 1907."
2nd Worst Stock Market Crash:
Date Started: 3/10/1937
Date Ended: 3/31/1938
Total Days: 386
Starting DJIA: 194.40
Ending DJIA: 98.95
Total Loss: -49.1%
Just when investors thought the market was finally good again, following a recovery of almost half of the great depression losses, the market plunged again due to war scare and Wall street scandals.
Worst Stock Market Crash Ever:
Date Started: 4/17/1930
Date Ended: 7/8/1932
Total Days: 813
Starting DJIA: 294.07
Ending DJIA: 41.22
Total Loss: -86.0%
This is the grand daddy of them all. Investors lost 86% of their money over this 813 day beast. This market crash combined with the 1929 crash, makes up the great depression.
Thanks for visiting...
00K
The email address is provided only as a courtesy to those readers who want to express their comments...
EMAIL- hotspotcharting-ook@yahoo.com
Disclaimer: The content in this blog is for leisure purposes only. The content is not intended as an offer or solicitation to buy or sell any securities. Do not use the content to make any investment decisions.
10th Worst Stock Market Crash:
Date Started: 1/15/2000Date Ended: 10/9/2002Total Days: 999Starting DJIA: 11,792.98Ending DJIA: 7,286.27Total Loss: -37.8%
This crash required the longest recovery time of all crashes in this list. The combination of the tech bubble bursting and the September 11th terrorist attack served a deadly blow to the stock market, but relative to markets past, this was a minor one.
9th Worst Stock Market Crash:
Date Started: 11/21/1916Date Ended: 12/19/1917Total Days: 393Starting DJIA: 110.15Ending DJIA: 65.95Total Loss: -40.1%
As you will see, this market suffered about a 40% loss. It's difficult to break even after a 40% loss. On a $1,000 investment, your portfolio went down to $600. To get back to $1,000, it would have to go up 66.7%!
8th Worst Stock Market Crash:
Date Started: 9/12/1939
Date Ended: 4/28/1942
Total Days: 959
Starting DJIA: 155.92
Ending DJIA: 92.92
Total Loss: -40.4%
Although this stock market crash only took the 8th spot, it was one of the most grueling. It took nearly 3 years to recover from this crash! With WWII and the attack on Pearl Harbor, the markets had a very tough time.
7th Worst Stock Market Crash:
Date Started: 1/11/1973
Date Ended: 12/06/1974
Total Days: 694
Starting DJIA: 1051.70
Ending DJIA: 577.60
Total Loss: -45.1%
Another long market crash -one that many people still remember (think Vietnam and the Watergate scandal). This crash lasted for 694 days before bottoming out.
6th Worst Stock Market Crash:
Date Started: 6/17/1901
Date Ended: 11/9/1903
Total Days: 875
Starting DJIA: 57.33
Ending DJIA: 30.88
Total Loss: -46.1%
This is the oldest crash to make the list (DJIA records are not available before 1900). Btw, The American flag had 45 stars....
The 5th worst stock market crash:
Date Started: 11/3/1919
Date Ended: 8/24/1921
Total Days: 660
Starting DJIA: 119.62
Ending DJIA: 63.9
Total Loss: -46.6%
After this crash bottomed out in August of 1921, the decade saw tremendous growth in the stock market and the economy (often called the roaring twenties).
4th Worst Stock Market Crash:
Date Started: 9/3/1929
Date Ended: 11/13/1929
Total Days: 71
Starting DJIA: 381.17
Ending DJIA: 198.69
Total Loss: -47.9%
Although this is the shortest market crash observed, it was a deadly one. Investors saw almost half their money disappear in just two months. Often this crash is the worst in most people's minds.
3rd Worst Stock Market Crash:
Date Started: 1/19/1906
Date Ended: 11/15/1907
Total Days: 665
Starting DJIA: 75.45
Ending DJIA: 38.83
Total Loss: -48.5%
This crash was called the "Panic of 1907."
2nd Worst Stock Market Crash:
Date Started: 3/10/1937
Date Ended: 3/31/1938
Total Days: 386
Starting DJIA: 194.40
Ending DJIA: 98.95
Total Loss: -49.1%
Just when investors thought the market was finally good again, following a recovery of almost half of the great depression losses, the market plunged again due to war scare and Wall street scandals.
Worst Stock Market Crash Ever:
Date Started: 4/17/1930
Date Ended: 7/8/1932
Total Days: 813
Starting DJIA: 294.07
Ending DJIA: 41.22
Total Loss: -86.0%
This is the grand daddy of them all. Investors lost 86% of their money over this 813 day beast. This market crash combined with the 1929 crash, makes up the great depression.
Thanks for visiting...
00K
The email address is provided only as a courtesy to those readers who want to express their comments...
EMAIL- hotspotcharting-ook@yahoo.com
Disclaimer: The content in this blog is for leisure purposes only. The content is not intended as an offer or solicitation to buy or sell any securities. Do not use the content to make any investment decisions.
Subscribe to:
Posts (Atom)
Blog Archive
-
▼
2007
(137)
- ► 06/10 - 06/17 (4)
- ► 05/20 - 05/27 (2)
- ► 05/13 - 05/20 (6)
- ► 05/06 - 05/13 (6)
- ► 04/29 - 05/06 (11)
- ► 04/22 - 04/29 (19)
- ► 04/15 - 04/22 (16)
- ► 04/08 - 04/15 (11)
- ► 04/01 - 04/08 (8)
- ► 03/25 - 04/01 (9)
- ► 03/18 - 03/25 (8)
- ► 03/11 - 03/18 (10)
- ► 03/04 - 03/11 (9)
- ► 02/25 - 03/04 (6)
- ► 02/18 - 02/25 (4)
- ► 02/11 - 02/18 (2)
- ► 02/04 - 02/11 (1)
- ► 01/21 - 01/28 (1)
- ► 01/14 - 01/21 (3)
-
►
2006
(142)
- ► 12/10 - 12/17 (4)
- ► 12/03 - 12/10 (5)
- ► 11/26 - 12/03 (8)
- ► 11/19 - 11/26 (6)
- ► 11/12 - 11/19 (12)
- ► 11/05 - 11/12 (12)
- ► 10/29 - 11/05 (19)
- ► 10/22 - 10/29 (22)
- ► 10/15 - 10/22 (7)
- ► 10/08 - 10/15 (14)
- ► 10/01 - 10/08 (9)
- ► 09/24 - 10/01 (7)
- ► 09/17 - 09/24 (1)
- ► 09/10 - 09/17 (1)
- ► 09/03 - 09/10 (3)
- ► 08/27 - 09/03 (2)
- ► 08/20 - 08/27 (3)
- ► 08/06 - 08/13 (2)
- ► 07/30 - 08/06 (4)
- ► 07/23 - 07/30 (1)