Monday's Economic Release:
US Leading Indicators (OCT) (15:00 GMT; 10:00 EDT)
Consensus: 0.2%..........Previous: 0.1%...........
Outlook: After falling short of prediction in September, the Conference Board’s Leading Indicators Index is expected to print another month of growth. Used to predict growth in the coming three to six months, the composite of 10 economic components is expected to grow 0.2 percent. If it should realize this rate of expansion, it would match the fastest pace of growth since March. From the number of known sub-gauges, a preliminary prediction can be formed. The equities’ portion should benefit from the 3.5 percent run in the S&P 500 over the period to a new multi-year high. From the labor barometer, a drop in the average weekly jobless claims from 313,800 in August to 311,500 in September will support the consumer sector. On the other hand, the slight drop in the Conference Board’s own consumer confidence indicator will act to offset it somewhat. Leveraging the negative, the second monthly drop in retail sales could leave the consumer goods orders component lower, while the 6.3 percent drop in building permits could prove the biggest detractor from the overall report. The market’s response to this composite may reveal the level of concern over the health of US growth. Since third quarter GDP slowed to a 1.6 percent pace of expansion, traders could be discounting a disappointing turn from the report already.
So you want to be in charge of monetary policy...
Play the Fed Chairman Game.
http://www.frbsf.org/education/activities/chairman/
Stocks expected to be range-bound as holiday approaches...
http://biz.yahoo.com/cbsm-top/061118/963cad05d27ef6d54c134eb68d2ba277.html?.v=1
(Not responsible for content found on other sites)
Thanks for visiting...
00K
The email address is offered only as a courtesy to those readers who want to express their comments...
EMAIL- hotspotcharting-ook@yahoo.com
Up,down or sideways? Review the charts for any clues that may help you with your own research. Thinking for yourself can be a pleasure and developing and applying strategic stock market research skills could give you the edge...
Saturday, November 18, 2006
Thursday, November 16, 2006
HOT SPOT CHARTING
Manufacturing measure beats analyst expectations slightly; gauge of future growth falls into negative territory.
NEW YORK (Reuters) -- Factory activity in the U.S. Mid-Atlantic region rebounded in November after contracting for the past two months, according to a survey released on Thursday.
The Philadelphia Federal Reserve Bank said its business activity index rose to 5.1 in November from -0.7 in October. Wall Street analysts had called for a rise of 5.0 in November.
Any reading above zero indicates growth in the region's manufacturing sector.
The new orders index, a gauge of future growth, fell to -3.7 in November from 13.4 in October.
The regional survey is one of the first indicators of U.S. manufacturing every month and is often used as a guidepost to the overall state of factories nationwide.
Wal-Mart Adds 11 States to $4 Drug Offer (AP)
http://biz.yahoo.com/ap/061116/wal_mart_prescription_drugs.html?.v=1
Growing investor complacency a concern (FT article on Yahoo News)
http://news.yahoo.com/s/ft/20061115/bs_ft/fto111520061350314737

(Click chart to enlarge)
NEW YORK (Reuters) -- Factory activity in the U.S. Mid-Atlantic region rebounded in November after contracting for the past two months, according to a survey released on Thursday.
The Philadelphia Federal Reserve Bank said its business activity index rose to 5.1 in November from -0.7 in October. Wall Street analysts had called for a rise of 5.0 in November.
Any reading above zero indicates growth in the region's manufacturing sector.
The new orders index, a gauge of future growth, fell to -3.7 in November from 13.4 in October.
The regional survey is one of the first indicators of U.S. manufacturing every month and is often used as a guidepost to the overall state of factories nationwide.
Wal-Mart Adds 11 States to $4 Drug Offer (AP)
http://biz.yahoo.com/ap/061116/wal_mart_prescription_drugs.html?.v=1
Growing investor complacency a concern (FT article on Yahoo News)
http://news.yahoo.com/s/ft/20061115/bs_ft/fto111520061350314737

(Click chart to enlarge)
Thanks for visiting...
00K
The email address is provided only as a courtesy to those readers who want to offer their comments...
EMAIL- hotspotcharting-ook@yahoo.com
00K
The email address is provided only as a courtesy to those readers who want to offer their comments...
EMAIL- hotspotcharting-ook@yahoo.com
Wednesday, November 15, 2006
HOT SPOT CHARTING
(Click charts to enlarge)

Semiconductor Index...

Potential ending wedge pattern...

Bearish (Doji) Star Pattern .
Potential reversal needs confirmation...
Charts and comments are NEVER INTENDED AS ADVICE...
Thanks for visiting...
00K
The email address is provided only as a courtesy to those readers who want to offer comments...
EMAIL- hotspotcharting-ook@yahoo.com

Semiconductor Index...

Potential ending wedge pattern...

Bearish (Doji) Star Pattern .
Potential reversal needs confirmation...
Charts and comments are NEVER INTENDED AS ADVICE...
Thanks for visiting...
00K
The email address is provided only as a courtesy to those readers who want to offer comments...
EMAIL- hotspotcharting-ook@yahoo.com
IN THE NEWS
Tech Bubble Warning Bells (USA Today)
US Airways Offers $8 Billion in Cash and Shares for Delta Air (Bloomberg)
U.K. Unemployment Rises to Five-Year High, Wages Slow (Bloomberg)
Jabil Circuit to Restate (The Street. com)

Not responsible for content found on other sites...
Thanks for visiting...
00K
EMAIL- hotspotcharting-ook@yahoo.com
00K
EMAIL- hotspotcharting-ook@yahoo.com
Tuesday, November 14, 2006
RUSSELL
(Click charts to enlarge)

Originally blogged November 10th...

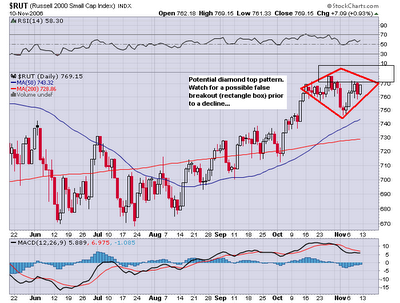
The RUSSELL 2000 did breakout into the rectangle as suggested. We will have to see if it is indeed a false breakout prior to a decline as described in the above Nov 10th chart. However the QQQQ target area is close but has not yet been met. Therefore additional upside remains in the Russell.
The flipside would be a continuation breakout which could produce a strong upwards move...
Either way confirmation is needed....
Thanks for visiting...
00K
EMAIL- hotspotcharting-ook@yahoo.com

Originally blogged November 10th...

The RUSSELL 2000 did breakout into the rectangle as suggested. We will have to see if it is indeed a false breakout prior to a decline as described in the above Nov 10th chart. However the QQQQ target area is close but has not yet been met. Therefore additional upside remains in the Russell.
The flipside would be a continuation breakout which could produce a strong upwards move...
Either way confirmation is needed....
Thanks for visiting...
00K
EMAIL- hotspotcharting-ook@yahoo.com
NASDAQ NEW HIGHS/LOWS
IN THE NEWS
U.S. chain store sales rise in latest week-Redbook
U.S. Producer Prices Fall 1.6% Last Month; Core Rate Down 0.9%
Japan's Service Index Falls on Consumer Spending Drop (Bloomberg Nov. 15)
http://www.bloomberg.com/apps/news?pid=20601087&sid=aM8x4zBxoewM&refer=home

Insight Enterprises Inc. said Monday that it had been notified that it faces delisting from the Nasdaq Stock Market for failure to file its third-quarter financial statement in a timely fashion.
Nov 15th potential market moving economic releases...
MBA Purchase Applications (wk11/10 , 2006)
NY Empire State Index (Nov , 2006)
EIA Petroleum Status Report (wk11/10 , 2006)
FOMC Minutes (Oct , 2006)
00K
U.S. Producer Prices Fall 1.6% Last Month; Core Rate Down 0.9%
Japan's Service Index Falls on Consumer Spending Drop (Bloomberg Nov. 15)
http://www.bloomberg.com/apps/news?pid=20601087&sid=aM8x4zBxoewM&refer=home

Insight Enterprises Inc. said Monday that it had been notified that it faces delisting from the Nasdaq Stock Market for failure to file its third-quarter financial statement in a timely fashion.
Nov 15th potential market moving economic releases...
MBA Purchase Applications (wk11/10 , 2006)
NY Empire State Index (Nov , 2006)
EIA Petroleum Status Report (wk11/10 , 2006)
FOMC Minutes (Oct , 2006)
00K
HOT SPOT CHARTING...
Monday, November 13, 2006
NEW YTD HIGH

Should the lack of volume while making a new ytd high
be a concern for tuesday?
Nov 14th potential market moving economic data...
ICSC-UBS Store Sales (wk11/11 , 2006)
Retail Sales (Oct , 2006)
Producer Price Index (Oct , 2006)
Redbook (wk11/11 , 2006)
Business Inventories (Sep , 2006)
Thanks for visiting...
00K
EMAIL- hotspotcharting-ook@yahoo.com
BANKS
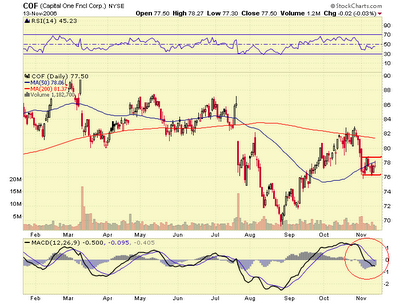
Banks and credit card issuers may come under pressure from rising bad debts...
(Click charts to enlarge)

Bank Index...

Testing new overhead resistance...

Top of channel...

EW #5...

Potential bear flag...
Rule number one is don't lose money.
Rule number two is don't forget rule number 1!
"Warren Buffett"
Thanks for visiting...
00K
EMAIL- hotspotcharting-ook@yahoo.com
(Click charts to enlarge)

Bank Index...

Testing new overhead resistance...

Top of channel...

EW #5...

Potential bear flag...
Rule number one is don't lose money.
Rule number two is don't forget rule number 1!
"Warren Buffett"
Thanks for visiting...
00K
EMAIL- hotspotcharting-ook@yahoo.com
Sunday, November 12, 2006
A LOOK AHEAD
Subscribe to:
Comments (Atom)
Blog Archive
-
►
2007
(137)
- ► 06/17 - 06/24 (1)
- ► 06/10 - 06/17 (4)
- ► 05/20 - 05/27 (2)
- ► 05/13 - 05/20 (6)
- ► 05/06 - 05/13 (6)
- ► 04/29 - 05/06 (11)
- ► 04/22 - 04/29 (19)
- ► 04/15 - 04/22 (16)
- ► 04/08 - 04/15 (11)
- ► 04/01 - 04/08 (8)
- ► 03/25 - 04/01 (9)
- ► 03/18 - 03/25 (8)
- ► 03/11 - 03/18 (10)
- ► 03/04 - 03/11 (9)
- ► 02/25 - 03/04 (6)
- ► 02/18 - 02/25 (4)
- ► 02/11 - 02/18 (2)
- ► 02/04 - 02/11 (1)
- ► 01/21 - 01/28 (1)
- ► 01/14 - 01/21 (3)
-
▼
2006
(142)
- ► 12/10 - 12/17 (4)
- ► 12/03 - 12/10 (5)
- ► 11/26 - 12/03 (8)
- ► 11/19 - 11/26 (6)
- ▼ 11/12 - 11/19 (12)
- ► 11/05 - 11/12 (12)
- ► 10/29 - 11/05 (19)
- ► 10/22 - 10/29 (22)
- ► 10/15 - 10/22 (7)
- ► 10/08 - 10/15 (14)
- ► 10/01 - 10/08 (9)
- ► 09/24 - 10/01 (7)
- ► 09/17 - 09/24 (1)
- ► 09/10 - 09/17 (1)
- ► 09/03 - 09/10 (3)
- ► 08/27 - 09/03 (2)
- ► 08/20 - 08/27 (3)
- ► 08/06 - 08/13 (2)
- ► 07/30 - 08/06 (4)
- ► 07/23 - 07/30 (1)


