QQQQ, weekly chart has the potential to produce an
inverted H & S pattern...
DJIA, weekly chart could consolidate with sidewise progression before moving higher...
$RUT, has the potential formation of a cup & handle...
A long term look at the Q's shows that it has been in a three year channel...
Happiness is not a goal, it is a by-product.
"Eleanor Roosevelt"
Thanks for visiting...
00K
EMAIL- hotspotcharting-ook@yahoo.com
Up,down or sideways? Review the charts for any clues that may help you with your own research. Thinking for yourself can be a pleasure and developing and applying strategic stock market research skills could give you the edge...
Friday, November 03, 2006
Thursday, November 02, 2006
The labor market
Online job ads flat in October, Monster says (Marketwatch.com)
http://www.marketwatch.com/News/Story/Story.aspx?guid=%7B8C5D2F5D%2D86FB%2D485A%2D83A0%2D9A3A147763F7%7D&source=blq%2Fyhoo&dist=yhoo&siteid=yhoo
Not responsible for content found on other sites...
EMAIL- hotspotcharting-ook@yahoo.com
http://www.marketwatch.com/News/Story/Story.aspx?guid=%7B8C5D2F5D%2D86FB%2D485A%2D83A0%2D9A3A147763F7%7D&source=blq%2Fyhoo&dist=yhoo&siteid=yhoo
Not responsible for content found on other sites...
00K
EMAIL- hotspotcharting-ook@yahoo.com
Channeling stocks under $5
HOT SPOT CHARTING
U.S. Sept. factory orders rise 2.1% vs. 3.8% expected (Marketwatch.com)
http://www.marketwatch.com/News/Story/Story.aspx?guid=%7BFF6BC108%2D2916%2D4E26%2D8677%2D8CE1D7C77217%7D&dateid=39023%2E4169237616%2D883999967&siteid=bigcharts
European Central Bank holds key interest rate (marketwatch.com)
http://www.marketwatch.com/News/Story/Story.aspx?guid=%7B9F142E70%2D8B89%2D4C3D%2DBD78%2D98009F6FAC50%7D&tool=1&siteid=bigcharts&dist=bigcharts
Wednesday, November 01, 2006
In the Spotlight...
November 02, 2006
Initial Claims
Productivity-Prel
Factory Orders
November 03, 2006
Nonfarm Payrolls
Unemployment Rate
Hourly Earnings
Average Workweek
ISM Services
EMAIL- hotspotcharting-ook@yahoo.com
Initial Claims
Productivity-Prel
Factory Orders
November 03, 2006
Nonfarm Payrolls
Unemployment Rate
Hourly Earnings
Average Workweek
ISM Services
EMAIL- hotspotcharting-ook@yahoo.com
KICKIN' THE TIRES
(Click any chart to enlarge)
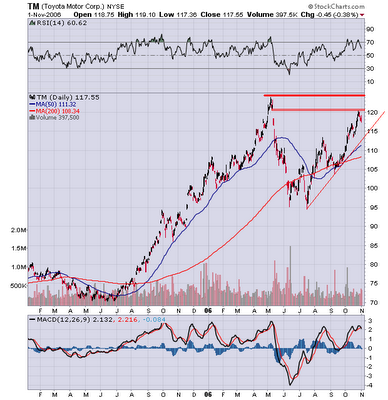
Toyota, very small gap left before major overhead
resistance...
GM, testing major overhead resistance...
Ford, bulls were trapped in September.
Major overhead resistance...
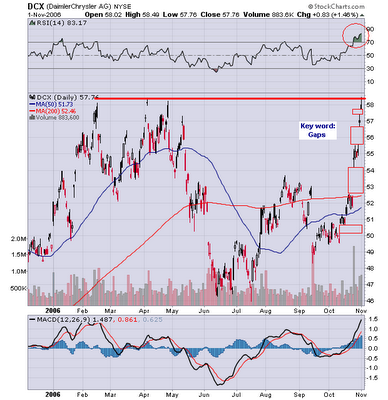
Daimler Chrysler, testing major overhead resistance.
Gap, gap, gap...
When I'm bearish and I sell a stock, each sale must be at a lower level than the previous sale. When I am buying, the reverse is true. I must buy on a rising scale. I don’t buy long stocks on a scale down, I buy on a scale up.
"Jesse Livermore"
EMAIL- hotspotcharting-ook@yahoo.com
Toyota, very small gap left before major overhead
resistance...
GM, testing major overhead resistance...
Ford, bulls were trapped in September.
Major overhead resistance...
Daimler Chrysler, testing major overhead resistance.
Gap, gap, gap...
When I'm bearish and I sell a stock, each sale must be at a lower level than the previous sale. When I am buying, the reverse is true. I must buy on a rising scale. I don’t buy long stocks on a scale down, I buy on a scale up.
"Jesse Livermore"
Thanks for visiting...
00K
EMAIL- hotspotcharting-ook@yahoo.com
Tuesday, October 31, 2006
Covered Calls & Retail Index Charts
CHIP GLUT?
Intel, Texas Instruments May Face Chip Glut
as Holidays Loom (Bloomberg.com)
http://www.bloomberg.com/apps/news?pid=20601087&sid=alGJJnX8OrSU&refer=home
(Click any chart to enlarge)
as Holidays Loom (Bloomberg.com)
http://www.bloomberg.com/apps/news?pid=20601087&sid=alGJJnX8OrSU&refer=home
(Click any chart to enlarge)
(Not responsible for content found on other sites)
00K
EMAIL- hotspotcharting-ook@yahoo.com
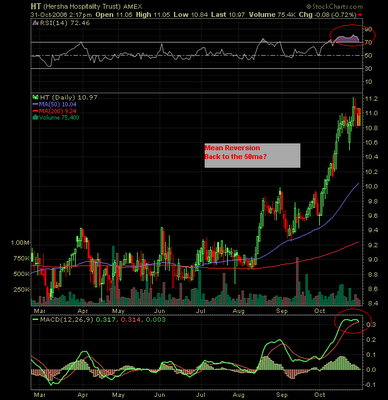
Trick or Treat at the BATES MOTEL
Dow Jones US Hotel Index:
The weekly chart is showing that this index is
at overhead resistance...
(The hotel stock charts below use a daily format)
Testing overhead resistance while showing
some negative divergence on the oscillator's...
Testing overhead resistance on declining volume...
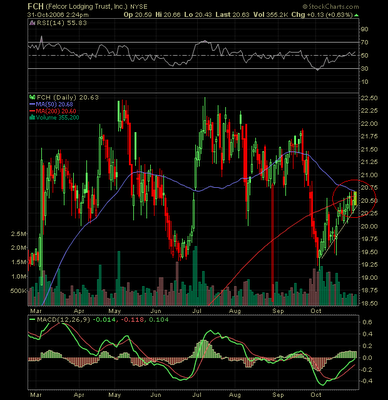
Will FCH overcome its 50 & 200ma and keep the
uptrend channel intact?
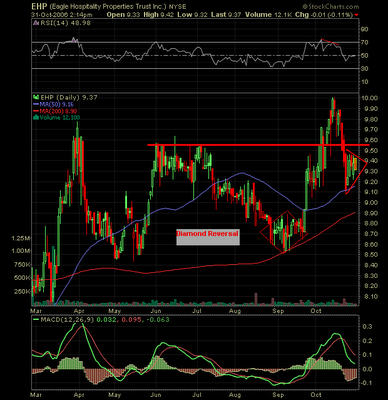
Potential bear flag.
Note the recent distribution days...
Pennant. Watch which way it breaks...
Broke downwards from a raising wedge...
Mean reversion comes to mind...
Charts and comments are NEVER INTENDED AS ADVICE...
Have a great Halloween!
00K
EMAIL- hotspotcharting-ook@yahoo.com
In the news (Links)
WASHINGTON (MarketWatch) -- U.S. consumer confidence dipped unexpectedly in October on growing pessimism about the job market and the economy, the Conference Board said Tuesday.
http://www.marketwatch.com/news/story/Story.aspx?guid=ad67bb8b-ce2d-42af-86d6-0386d248d1a0&siteid=mktw&dist=morenews
WASHINGTON (MarketWatch) -- The Chicago region's economy weakened sharply in October with a worrisome rise in inventories, according to the Chicago purchasing managers' index released Tuesday.
http://www.marketwatch.com/news/story/Story.aspx?guid=a0d95bd2-2a99-48db-bec7-8eb5e32a8d42&siteid=mktw&dist=morenews
WASHINGTON (MarketWatch) -- Consumer sentiment strengthened slightly in late October, according to media reports Friday of proprietary research from the University of Michigan.
http://www.marketwatch.com/news/story/Story.aspx?guid=aa484c08-c8e6-4ef7-b42d-7387548fd862&siteid=mktw&dist=morenews
UBS Reports 21% Decline in Profit on Trading Slump
Oct. 31 (Bloomberg) -- UBS AG, Europe's biggest bank by assets, said third-quarter profit fell 21 percent, missing analysts' estimates after trading revenue dropped at its securities unit.
http://www.bloomberg.com/apps/news?pid=20601087&sid=aWEFcP22LU2g&refer=home
There are nights when the wolves are silent and only the moon howls.
~George Carlin
00K
EMAIL- hotspotcharting-ook@yahoo.com
Monday, October 30, 2006
Booo....
Let's try halloween orange.
(Click any chart to enlarge)
A look at a few hourly charts before tuesday's open...
QQQQ, rebounded a bit from fridays decline.
Closed below support...
IWM, closed at the 21ma but took heavy selling
an hour before the close...
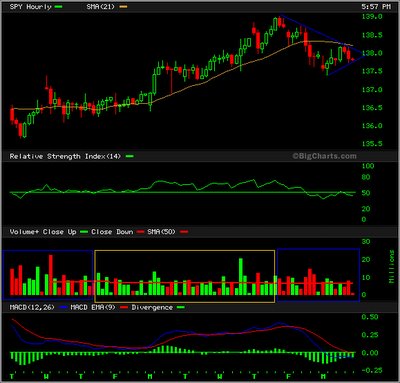
SPY, stayed below its 21ma all day.
Watch which way it breaks...
DIA, closed at support. Note the RSI turned
back at the 50 line...
Just like a ghost, you've been a-hauntin' my dreams,
So I'll propose on Halloween.
Love is kinda crazy with a spooky little girl like you.
~Classics IV
Thanks for visiting...
00K
EMAIL- hotspotcharting-ook@yahoo.com
Percent of stocks above 50dma......
Upcoming Expo's
Futures & Options Expo 2006
http://www.futuresindustry.org/expo2006-2658.asp
The Traders Expo Las Vegas
http://www.tradersexpo.com/tradersexpo/lasvegas/main.asp
(Not responsible for content found on other sites)
00K
http://www.futuresindustry.org/expo2006-2658.asp
The Traders Expo Las Vegas
http://www.tradersexpo.com/tradersexpo/lasvegas/main.asp
(Not responsible for content found on other sites)
00K
Volatility Indexes
The Volatility Index, which shows the market's expectation of 30-day volatility. It is constructed using the implied volatilities of a wide range of S&P 500 index options. This volatility is meant to be forward looking and is calculated from both calls and puts. The VIX is a widely used measure of market risk...
00K
EMAIL- hotspotcharting-ook@yahoo.com
Sunday, October 29, 2006
Click any chart to enlarge...
Japan's Industrial Production Slipped 0.7% From Record in Sept.
http://www.bloomberg.com/apps/news?pid=20601087&sid=aeyQ6hABlgVI&refer=home
Shares of Rinker Group were up sharply Friday following Cemex’s bid to buy the Australian company for $12.8 billion.
http://www.forbes.com/business/2006/10/27/cemex-rinker-update-markets-equity-cx_mk_1027markets12.html
RIN & CX charts are provided to accompany the story above...
(Not responsible for content found on other sites)
Brief review of RSI & MACD indicators...
The Relative Strenghth Index-RSI, is a technical momentum indicator that compares the magnitude of recent gains to recent loses.
Buy and sell signals can be generated by looking for positive and negative divergences between the RSI and the underlying stock.
The RSI is best used when combined with other stock-picking tools...
Moving Average Convergence Divergence - MACD, is a trend following momentum indicator that shows the relationship between two moving averages of prices.
1. Crossovers - As shown in the chart above, when the MACD falls below the signal line, it is a bearish signal, which indicates that it may be time to sell. Conversely, when the MACD rises above the signal line, the indicator gives a bullish signal, which suggests that the price of the asset is likely to experience upward momentum. Many traders wait for a confirmed cross above the signal line before entering into a position to avoid getting getting "faked out" or entering into a position too early.
2. Divergence - When the security price diverges from the MACD. It signals the end of the current trend.
3. Dramatic rise - When the MACD rises dramatically - that is, the shorter moving average pulls away from the longer-term moving average - it is a signal that the security is overbought and will soon return to normal levels. Also watch for a move above or below the zero line because this signals the position of the short-term average relative to the long-term average. When the MACD is above zero, the short-term average is above the long-term average, which signals upward momentum. The opposite is true when the MACD is below zero...
To know is to do!
"Socrates"
Thanks for visiting...
00K
EMAIL- hotspotcharting-ook@yahoo.com
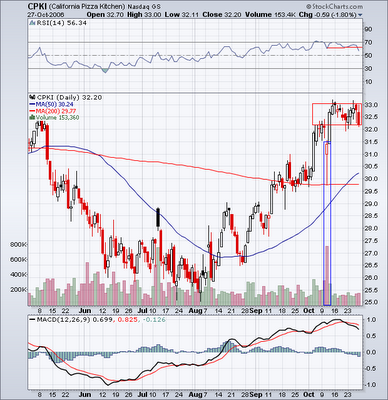
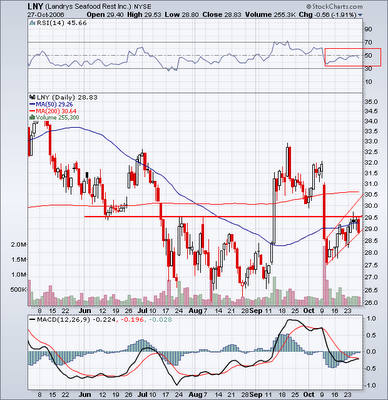
Let's look at a few restaurants...
- Monday's HOT SPOT CHARTING short candidate
OSI May Restate Results Over Gift Cards
Potential liability for the restaurant chain is estimated at between $20 million and $40 million.
http://www.cfo.com/article.cfm/8097376/c_8098516?f=home_todayinfinance
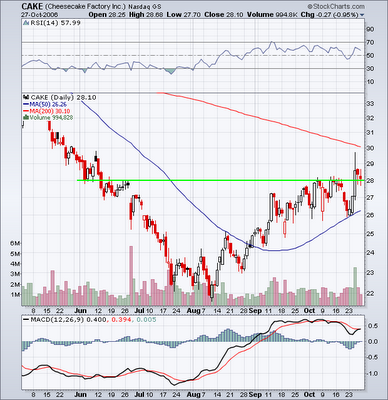
CAKE, closed at support...
CPKI, closed at support. RSI moved below trendline.
Note the recent massive distribution day...
LNY, upwards channel but turned away at resistance.
Watch which way it breaks...
The big money is made by the sitting, not the thinking.
Once a position is taken, the hardest thing to do is to be patient and wait for the move to play out.
"Jesse Livermore"
EMAIL- hotspotcharting-ook@yahoo.com
Subscribe to:
Posts (Atom)
Blog Archive
-
►
2007
(137)
- ► 06/17 - 06/24 (1)
- ► 06/10 - 06/17 (4)
- ► 05/20 - 05/27 (2)
- ► 05/13 - 05/20 (6)
- ► 05/06 - 05/13 (6)
- ► 04/29 - 05/06 (11)
- ► 04/22 - 04/29 (19)
- ► 04/15 - 04/22 (16)
- ► 04/08 - 04/15 (11)
- ► 04/01 - 04/08 (8)
- ► 03/25 - 04/01 (9)
- ► 03/18 - 03/25 (8)
- ► 03/11 - 03/18 (10)
- ► 03/04 - 03/11 (9)
- ► 02/25 - 03/04 (6)
- ► 02/18 - 02/25 (4)
- ► 02/11 - 02/18 (2)
- ► 02/04 - 02/11 (1)
- ► 01/21 - 01/28 (1)
- ► 01/14 - 01/21 (3)
-
▼
2006
(142)
- ► 12/10 - 12/17 (4)
- ► 12/03 - 12/10 (5)
- ► 11/26 - 12/03 (8)
- ► 11/19 - 11/26 (6)
- ► 11/12 - 11/19 (12)
- ► 11/05 - 11/12 (12)
-
▼
10/29 - 11/05
(19)
- THE BULL CASE
- $VIX
- 2/21
- The labor market
- Channeling stocks under $5
- HOT SPOT CHARTING
- In the Spotlight...
- RALLY on THURSDAY?
- KICKIN' THE TIRES
- Covered Calls & Retail Index Charts
- CHIP GLUT?
- Trick or Treat at the BATES MOTEL
- In the news (Links)
- Booo....
- Percent of stocks above 50dma......
- Upcoming Expo's
- Volatility Indexes
- Click any chart to enlarge...
- Let's look at a few restaurants...
- ► 10/22 - 10/29 (22)
- ► 10/15 - 10/22 (7)
- ► 10/08 - 10/15 (14)
- ► 10/01 - 10/08 (9)
- ► 09/24 - 10/01 (7)
- ► 09/17 - 09/24 (1)
- ► 09/10 - 09/17 (1)
- ► 09/03 - 09/10 (3)
- ► 08/27 - 09/03 (2)
- ► 08/20 - 08/27 (3)
- ► 08/06 - 08/13 (2)
- ► 07/30 - 08/06 (4)
- ► 07/23 - 07/30 (1)