Up,down or sideways? Review the charts for any clues that may help you with your own research. Thinking for yourself can be a pleasure and developing and applying strategic stock market research skills could give you the edge...

Google

Thursday, March 22, 2007

HOT SPOT CHARTING...

(Click charts to enlarge)

QQQQ, Still could try to complete a successful back test of the 50ma.
Potential bearish harami candlestick reversal pattern.
Will need confirmation by a close below the 50ma...


QID, ProShares ultra short.
Potential bullish harami reversal candlestick pattern.
Will need confirmation by a close above the 50ma...


EK, Showed a sign of exhaustion today.
May need a few more days of back and fourth before trying the lower support line unless it pulls together and gets above the neckline...


(Originally blogged on March 1st)

Could there be a date with the neckline around the first week of April?

The S&P 500 O-Strip Index is a subset of the S&P 500 index.
It is the S&P 500 stocks that are listed on NASDAQ, which
amounts to approximately 75 NASDAQ traded stocks.


Arrived a little early........
Could see plenty of resistance or a trend change at the red upper trend line....


Charts and comments are NEVER INTENDED AS ADVICE...

Thanks for visiting...

00K


The email address is provided only as a courtesy to those readers who want to express their comments...

EMAIL- hotspotcharting-ook@yahoo.com

Wednesday, March 21, 2007

HOT SPOT CHARTING...

(Click charts to enlarge)

KLAC, Will it breakout...........
Note the evening star prior to February's market turn...


Could the SOX be warning again or will it finally breakout from the multi month trading range....


AAV is an energy play trying to get over the 50ma.
Also pays about a 15% dividend...
(I own some shares)

Charts and comments are NEVER INTENDED AS ADVICE......

Thanks for visiting...

00K


The email address is provided only as a courtesy to those readers who want to express their comments...

EMAIL- hotspotcharting-ook@yahoo.com

THE BERNANKE PUT...

(Click charts to enlarge)

QQQQ, Look close.
The last time we had a similar display the following day we tested the 50ma...


$VIX, closed the gap today and closed above gap support.
If by chance (???) it makes it back inside the wedge its hard to imagine that it will stay there long before breaking out again...


Thanks for visiting...

00K


The email address is provided only as a courtesy to those readers who want to express their comments...

EMAIL- hotspotcharting-ook@yahoo.com

Tuesday, March 20, 2007

HANG SENG...


HANG SENG...


Thanks for visiting...

00K


The email address is provided only as a courtesy to those readers who want to express their comments...

EMAIL- hotspotcharting-ook@yahoo.com

Monday, March 19, 2007

Waiting for the other shoe to drop...


Post FOMC meeting?


QQQQ,weekly chart...


Thanks for visiting...

00K


The email address is provided only as a courtesy to those readers who want to express their comments...

EMAIL- hotspotcharting-ook@yahoo.com
HOT SPOT CHARTING...


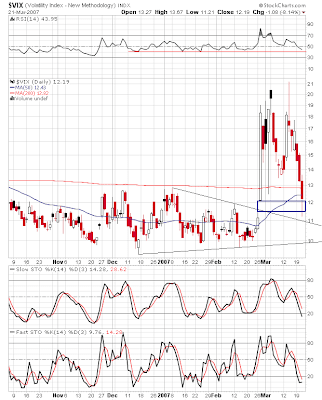
Volatility Index...


Nikkei, Having a rally today and will likely close at resistance...


QQQQ, If it can overcome the 43.30 area there could be heavy resistance at the 50ma area...


SPY, Watch the channel resistance and the converging channel & horizontal resistance around 142...

Futures are up tonight but check the economic calendar below.
Adverse data this week can bring these market's down swiftly...


Thanks for visiting...

00K


The email address is provided only as a courtesy to those readers who want to express their comments...

EMAIL- hotspotcharting-ook@yahoo.com

Sunday, March 18, 2007

Economic Calendar

Mar 19
Housing Market Index (Mar , 2007)
Mar 20
ICSC-UBS Store Sales (wk3/17 , 2007)
Mar 20
Housing Starts (Feb , 2007)
Mar 20
Redbook (wk3/17 , 2007)
Mar 20
State Street Investor Confiden (Mar , 2007)
Mar 20
FOMC Meeting Begins (Feb , 2007)
Mar 21
MBA Purchase Applications (wk3/16 , 2007)
Mar 21
EIA Petroleum Status Report (wk3/16 , 2007)
Mar 21
FOMC Meeting Announcement (Feb , 2007)
Mar 22
Jobless Claims (wk3/17 , 2007)


00K


The email address is provided only as a courtesy to those readers who want to express their comments...

EMAIL- hotspotcharting-ook@yahoo.com

BUCKLE UP...

(Click charts to enlarge)


DJ UK Titan 50 Index.
Potential bear flag...


DJ World ex America's Index.
Potential diamond top formation...


DJ World ex Asia Index.
Potential diamond top formation...


DJ France Titans 30 Index.
Potential diamond top formation or potential bear flag...


DJ Germany Titans 30 Index.
Potential diamond top formation or potential bear flag...


DJ South Africa Titans 30 Index.
Potential bear flag...


DJ Sweden Titans 30 Index...
Broke from a rising wedge formation...


DJ Spain Titans 30 Index.
Potential head & shoulders formation...


Last week it looked like there was a chance the indexes would breakout to the upside.
However comments from Alan Greenspan (Greenspan: Subprime risk may spread) and higher inflation data quickly curbed the two day advance...


Downside risk appears high...
One caveat is that the above world charts are all using a weekly time frame.
Therefore the potential diamond pattern's could take a few weeks to play out but a daily high impact sell off can happen at anytime......

Charts and comments are NEVER INTENDED AS ADVICE...

Good luck trading...

00K


The email address is provided only as a courtesy to those readers who want to express their comments...

EMAIL- hotspotcharting-ook@yahoo.com